Icon_01
The Developmental And Financial Cost Of Natural Disasters

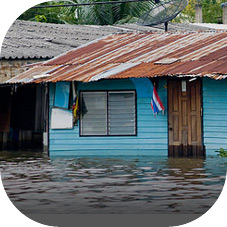
When record floods inundated large swaths of Thailand, including its capital Bangkok, in the fall of 2011, total damage and loss amounted to THB 1.43 trillion (US$46.5 billion), more than 13 percent of that year’s gross domestic product (GDP). But the financial impact on the government continued long after the water finally receded.The floods were estimated to reduce real GDP growth in 2011 by 1.1 percent from pre-flood projections, reduced Thailand’s current account to US$11.9 billion from a projected $20.6 billion, and caused a 3.7 percent loss in tax revenue from estimated pre-flood revenues (World Bank and Government of Thailand 2012).

Financial losses from natural disasters continue to rise, with developing countries and their low income population feeling the greatest effects.

More info & Case Studies

Direct disaster loss by income group Read more

Direct financial loss reached an average of $165billion per year during the last 10 years, with loss exceeding $100 billion in six of those years.


Relative distribution of direct loss between high-,middle-,and low income countries across time (as percent of total annual direct loss) Read more

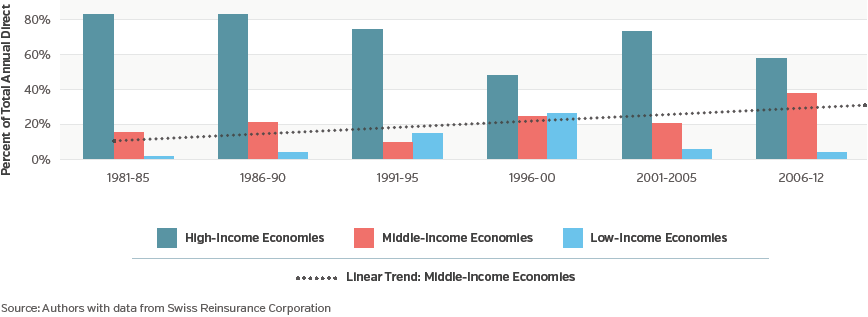
The trends in losses hide a wide range of impact. The relative share of this loss occurring in middle-income countries has seen a steady upward trend over the past 30 years (in 2012 U.S. dollar).

The rapid growth of assets exposed to hazards in middle-income countries—for example through urbanization and new infrastructure—is likely responsible for much of this increase.


Distribution of direct losses (1980 - 2012) on country income groups as % of GDP Read more

As a percentage of GDP, fast-growing middle-income countries suffer the most, with average annual direct loss at 2.9 percent of GDP, followed by low-income countries (1.3 percent of GDP) and high-income countries (0.8 percent of GDP) (Munich Re 2013).

Although average direct loss relative to GDP is less for low-income countries, this does not consider the most important impact—the loss of lives, livelihoods and negative effects on human capital.


Average annual loss fom disasters as percentage of GDP in small islands developing states Read more

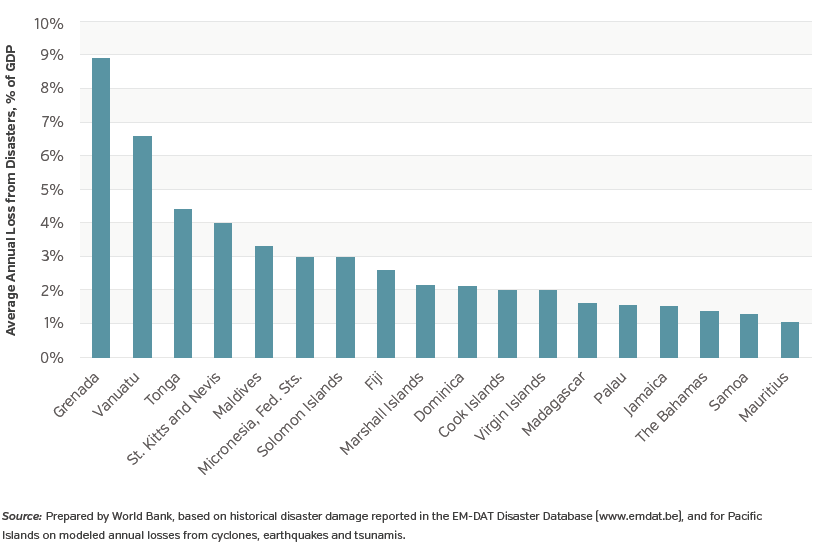
Small island states across the Caribbean and Pacific bear average losses exceeding over 3 percent of their respective GDP every year (World Bank and United Nations 2010; Pacific Catastrophe Risk Assessment and Financing Initiative [PCRAFI] 2011).


Financial Impact of Natural Disasters on Different Groups across Society

In mitigating the financial impact of disasters, experience shows that policy makers are primarily concerned with its effect on the government, homeowners and small and medium-sized enterprises (SMEs), farmers, and the poorest. This segmentation is largely the result of the type of cost associated with a disaster—for example, both homeowners and SMEs are concerned with building damage. Natural disasters directly and indirectly affect the financial and developmental stability of these groups. These are then discussed in turn.

Government Read more

Direct

  • Emergency response and recovery expenditures;
  • Reconstruction expenditures for uninsured/underinsured public infrastructure, public buildings, and often low-income housing;
  • Costs for improvements of reconstructed infrastructure, as well as for relocation of at-risk population;
  • Expenditure on social and economic recovery support programs;
  • Realization of contingent liabilities to state-owned enterprises, to firms that are critical to economic recovery, etc.


More info & Case Studies

Indirect

  • Decreased tax revenue due to economic disruption and declines in GDP growth;
  • Opportunity cost of diverting funds from development and social programs to disaster response and reconstruction;
  • Increased domestic/international borrowing costs;
  • Potential negative impact on sovereign credit rating;
  • Increased expenditures for social support programs (safety nets);
  • Migration due to disaster impact (loss of livelihoods).


More info & Case Studies
Homeowners and SMEs Read more

Direct

  • Reconstruction costs due to damage of often uninsured or underinsured assets;
  • Health and other financial costs associated with human fatalities, injuries, and disabilities.


More info & Case Studies

Indirect

  • Loss of income/livelihood due to business interruption/unemployment or loss of wage earner;
  • Loss of income/livelihood due to economic decline;
  • Increased borrowing costs;
  • Additional expenses such as health care and paying for alternative accommodation during reconstruction.


More info & Case Studies
Farmers Read more

Direct

  • Reconstruction costs for often uninsured or underinsured assets
  • Restocking/replanting/rehabilitation of productive assets such as livestock or crops.


More info & Case Studies

Indirect

  • Loss of income for farmers and other supply chain actors due to interruption of crop/livestock/fish stock production;
  • Loss of income for farmers and other supply chain actors due to economic decline and/or lack of access to markets;
  • Increased borrowing costs;
  • Increased risk aversion to new and innovative investments, leading to adoption of low-yield but safer seed varieties.


More info & Case Studies
The poorest Read more

Direct

  • Reconstruction costs for damaged assets;
  • Replacement of livestock.


More info & Case Studies

Indirect

  • Decreases in expenditure on food, accommodation, and human capital (possibly combined with higher costs for healthcare, education, etc);
  • Loss of social support due to breakdown in informal safety net systems such as family and community support;
  • Loss of income and unemployment;
  • Increased borrowing costs.


More info & Case Studies